How to Read Speed Reports (GTmetrix, Pingdom, PageSpeed)
Knowledgebase Article
Knowledgebase Article
There are multiple web tools that help developers and site administrators to measure their sites' speed and performance by running different test on them. The most commonly used ones are GTmetrix, Pingdom and Google's PageSpeed.
While these tools indeed provide useful information, the most important this is to know how to read and understand those results, we will cover that in this article.
Before we move into that, we need to address what TTFB means since it will appear multiple times on this article and it usually is the first benchmark used to measure a website's performance. TTFB means Time to First Byte, in simple words, it's how long it takes for the visitor's browser to get a reply from the server after a request.
The TTFB is affected by 2 major factors, the site's code and how fast the server can process that code:
1 - Site's code: Nowadays most of the websites are made using CMSs like WordPress, Magento, Odoo, etc, so the site's code performance is actually down to the number of plugins installed (the more plugins the slower the site will be), possible loops or locks in database queries and uncached requests.
2 - Server's processing speed: Contrary to what one would think, the server's speed itself rarely is an issue.
If the TTFB performance isn't ideal, then the most likely cause is either using an outdated PHP version without OPcache (we detail how to change an account's PHP version in this article) or an unoptimized database (for example, it can be missing indexes).
Another major factor in the server's processing speed is having dynamic caching enabled and configured on the site. If the server can provide a cached version of the website instead of dynamically generating it on each request, then the response times will be much better and the site's resource usage will be lower since it will need to span fewer processes.
So, how can I improve my site's TTFB? Well, the simplest, most efficient and better performing option is to enable and configure LiteSpeed Cache.
LiteSpeed Cache not only improves the TTFB by accelerating the server's processing, it also helps to improve the site's code performance. This is possible because LiteSpeed Cache is more than a cache plugin, it's a full optimization suite, for example, it allows you to minimize and optimize your site's HTML code, as well as CSS and JS. It can also optimize the site's image gallery limit WordPress' Heartbeat executions, etc.
Now, let’s dive into the three site speed tools and understand how to interpret the results.
This is an example GTmetrix result: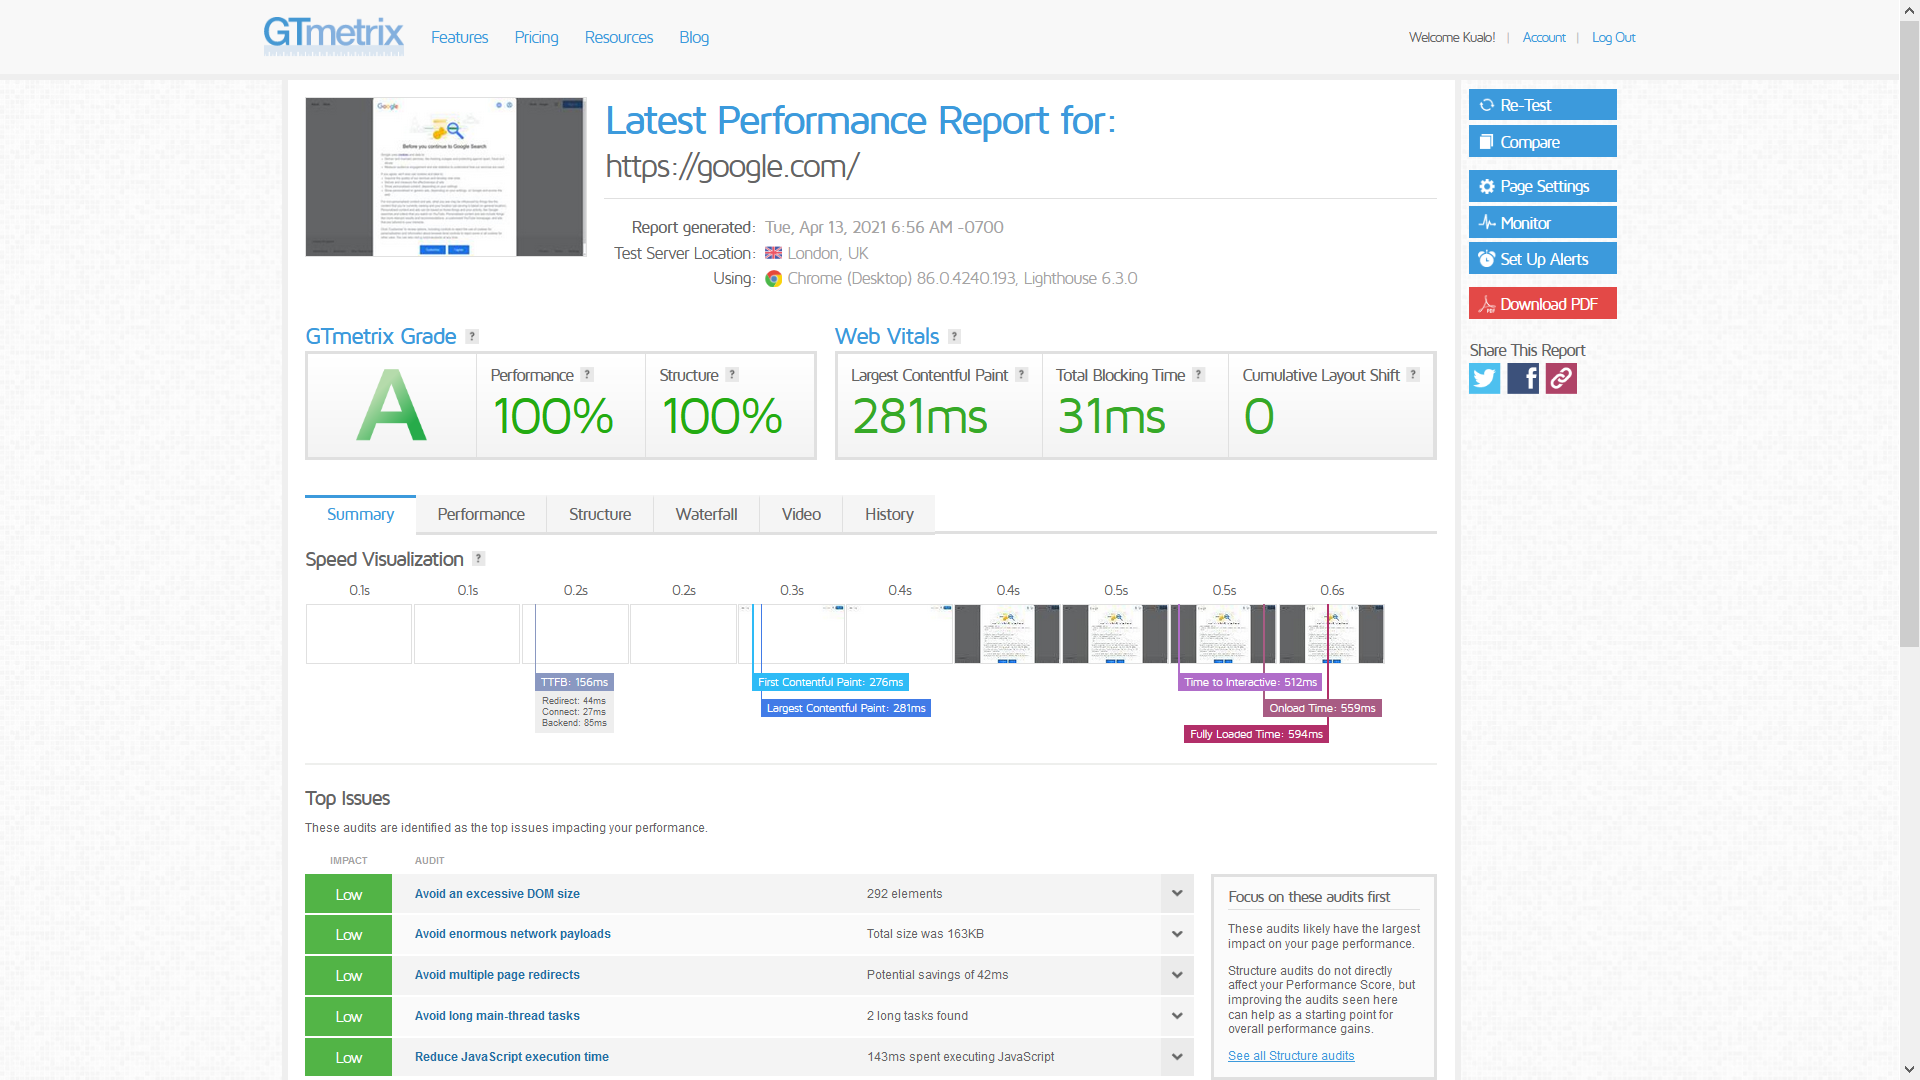
One would naturally think that getting an A means that the website is performing fast and getting an F means that it's slow and sluggish, however that isn't actually true. The A to F grading is given based on the site's load times as well as its structure and code, so a really fast site can have an E or D grade because its code doesn't comply with enough of GTmetrix's recommendations.
The next logical question would be, how can I know how fast my site is then? Well, that is fairly simple, but first, you have to make sure that you are running the test correctly, otherwise, you will get the wrong results.
By default, GTmetrix run the test from Vancouver, Canada, and our servers are located in Tampa, USA and London, UK, so if you run the test from the default location the results will be over 75 milliseconds and 136 milliseconds slower (due to latency) for each element that is server from your site. Since a website can have hundreds or even thousands of elements (images, JS, CSS, etc) that handful of milliseconds can add up really fast and reach 1 or even more seconds easily. Because of this is really important to make sure to chose the closest possible location to the server when doing a performance test, otherwise, the results will be distorted by the latency.
So, to run a proper GTmetrix test you will have to register there first, next click on Analysis Options (1) and then select London (for UK services) or San Antonio (for USA services) (2):
At this point, you should have run a valid test of your site's performance. Now, how to read it? Well, there are actually 3 really important sections you should check:
1 - Speed Visualization: The most important part here is the TTFB (Time to First Byte). It should be of 0.5 seconds or less on sites without dynamic caching or 0.2 or less on sites with cache.
If your plan has LiteSpeed Cache you should enable and configure it following the article corresponding to your website available here. If your website is a WordPress and you don't have LiteSpeed Cache available, then a good alternative would be to install and configure W3 Total Cache or WP Fastest Cache, we also have a guide for that.
Also, in WordPress sites replacing the wp-cron with an actual cronjob does a major difference in TTFB and overall performance.
2 - Performance: This tab will show a new section with several time measures. Each one has a brief description and a reference value, so we won't detail it here.
3 - Waterfall: This tab will also show a new section where the content will be a schema of how each of the site's components is loaded and how long it takes. As this option is really useful we will detail it next.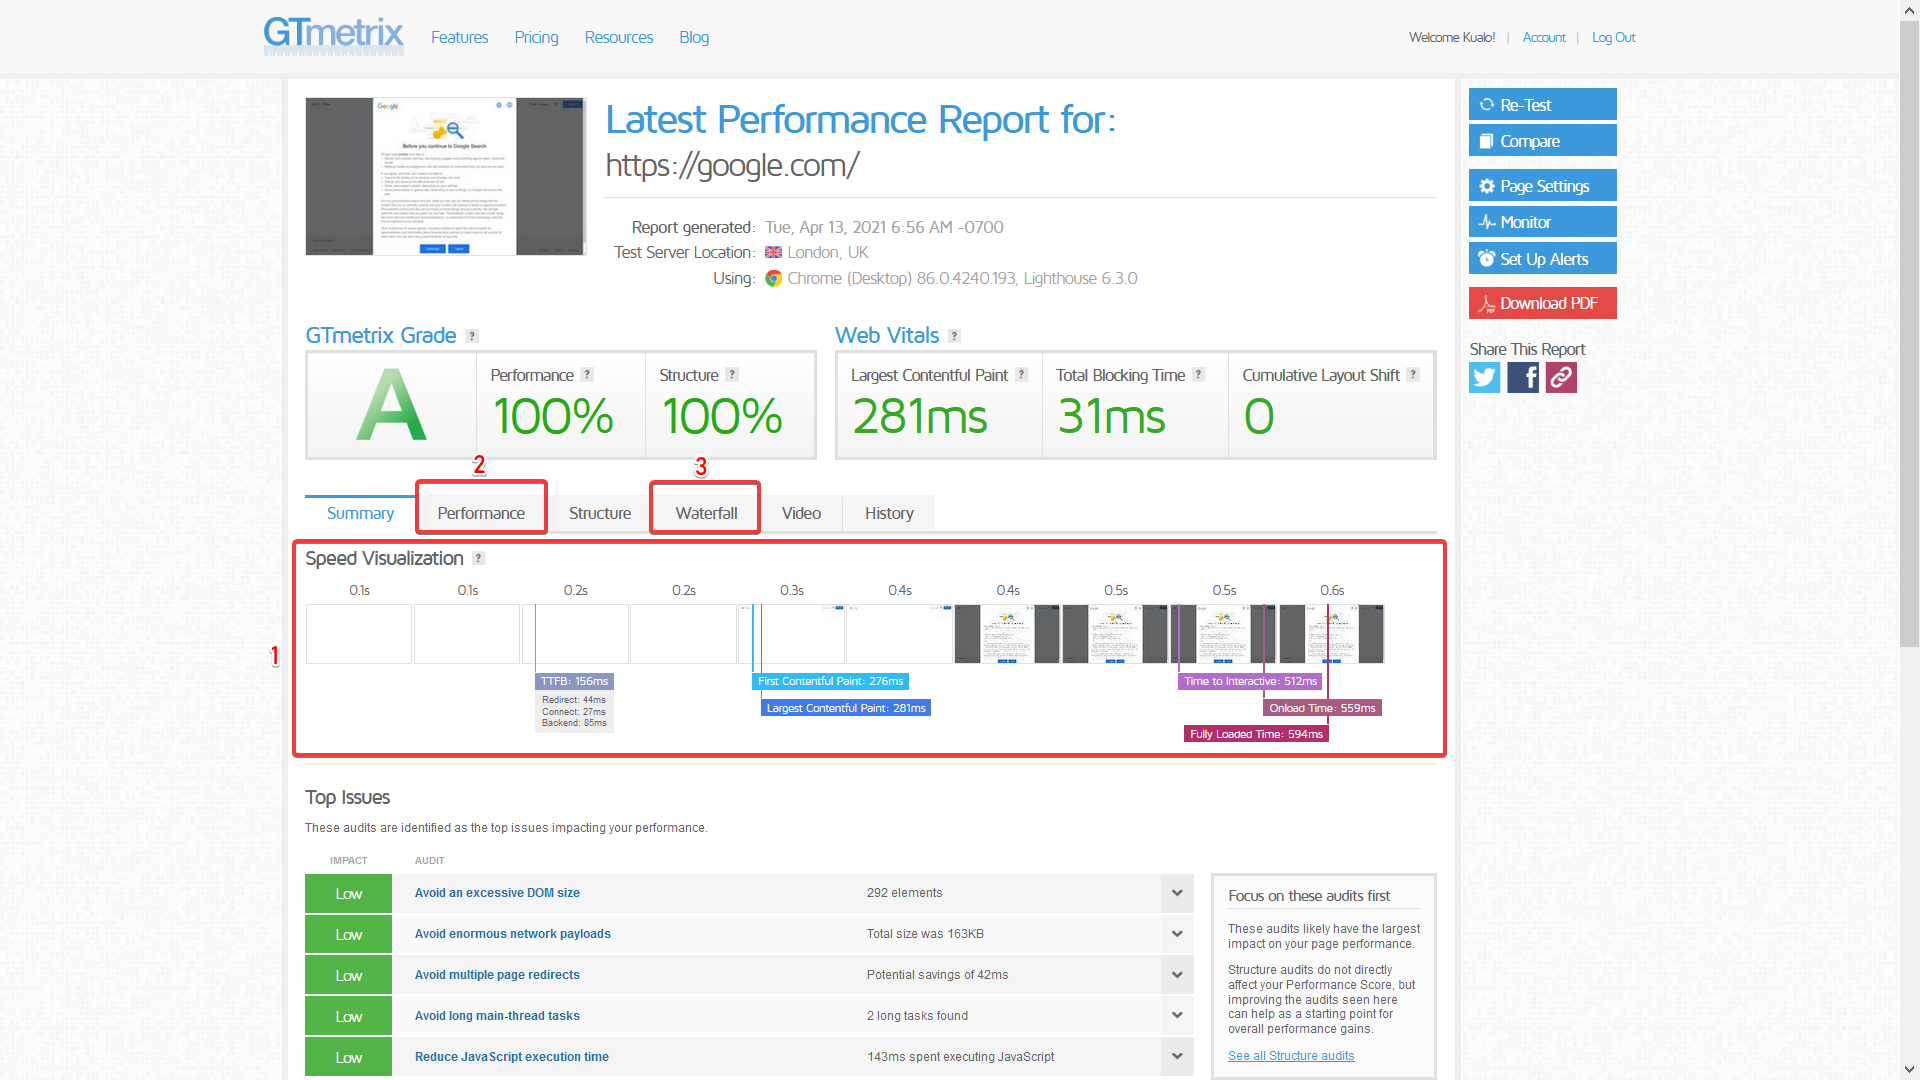
This is the Waterfall section:
The important information here is the schema that shows how long each component takes to load. If one particular component is too slow it can lock the rest of the website from loading until it's completed, so it's important to address any slow ones.
The type of each slow component determines how to fix it, for example, if it's an image that is too big it can be fixed by compressing and optimizing it. If the issue is with a remote element, like a CSS or a font that is loaded from an external server, then the solution would be to host that file locally. If the issue is with a JS file, then its execution can be disabled, or configured to run fewer times, like WordPress's Heartbeat AJAX with this plugin.
Pingdom provides less information than GTmetrix, but it still can be useful.
As with GTmetrix, the correct location must be selected in order to do a correct test of the site's performance. Here it isn't needed to create an account, the location can be selected directly from the test page. The recommended location for USA-based customers is Washington DC, and for UK ones, London.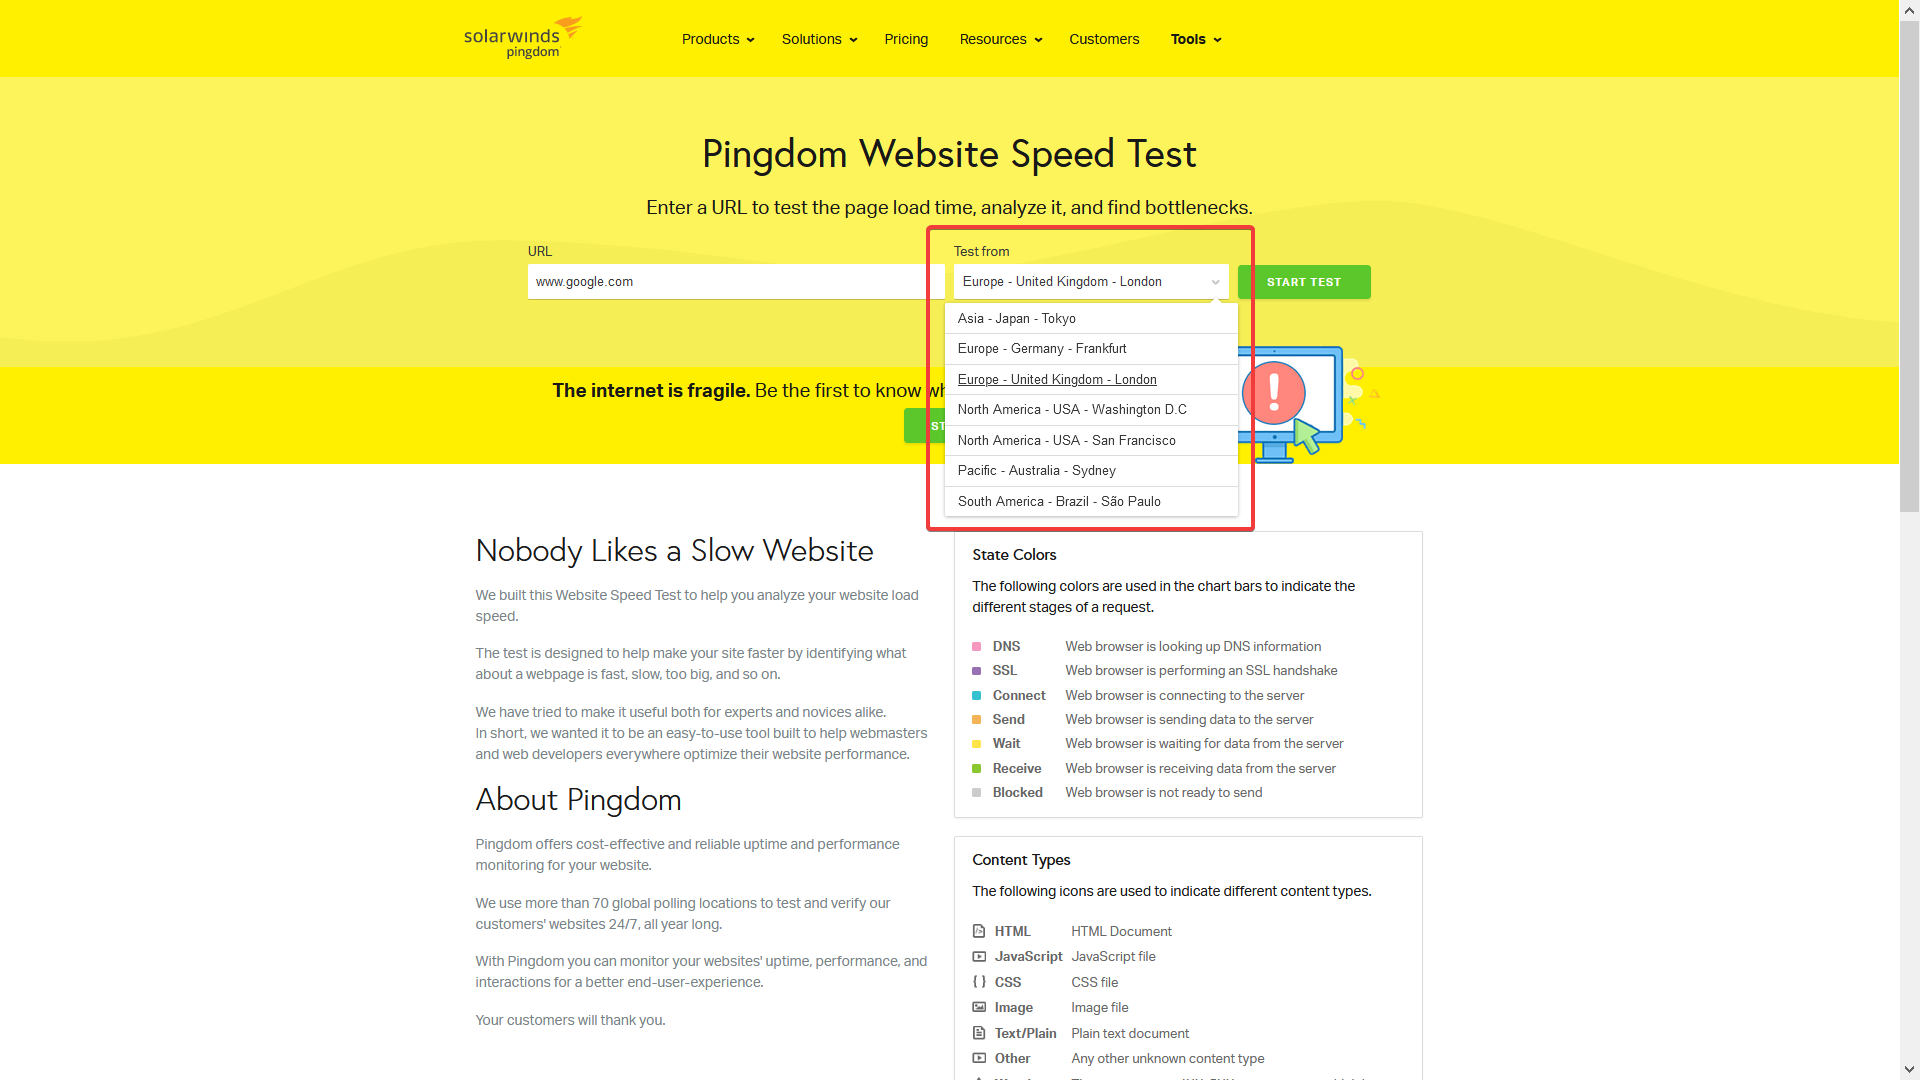
The results are all shown on the same page, there aren't different tabs to check. The result page will look like this:
1- Load Time: Unlike GTmetrix, Pingdom doesn't show a detail of the different stages of the load, it only gives the total time. This is less useful than GTmetrix's detailed report, but it can still be used to have an idea of the overall load time and with the help of the other information provided it can point to the cause of any possible issues slowing down the site.
2 - Performance Recommendations: This includes multiple things, from the website's headers and redirects to DNS lookups and cache. Most of these optimizations would have to be reviewed with a web developer since they usually require changes to the site's configuration and in some cases code.
3- Size by Type: This is similar to GTmetrix's Waterfall tab, but instead of providing a detailed report of each element size and load time it just adds the load time by content type. It's still useful because it can point to the issues described on GTmetrix's Waterfall explanation, like images being too big or missing optimization.
As with GTmetrix, Pindom's Performance grade doesn't necessarily equal site speed, since it's evaluating response times as well as site structure, redirects, DNS queries among many other aspects. So, this still applies:
Google's PageSpeed Insights provides similar information to GTmetrix, only in a different way. This is an example result page:

The first difference with the previous tools is that PageSpeed doesn't allow to select the location from which the test is run from, it's automatically defined.
The second one, and it's a very major one, is that the results shown by default are for the mobile version of the website. Since the tests made by PageSpeed for mobile and desktop are actually quite different, it's really important to remember to change to the "DESKTOP" tab on top of the screen.
Unlike with GTmetrix and Pingdom, the Performance score here is a closer indicative of the site's load times, since it doesn't take into account the site's structure or other characteristics. The score is composed of several sections which will add up to 100, if any of those sections don't comply with Google's directives the score is lowered. A detailed explanation of how the score is calculated by Google is published here.
Now, the Performance score isn't the only useful thing here. There are 4 other important sections:
1 - First Input Delay: This is similar (although not exactly the same) as the TTFB. The expected values and how to improve them were aborded on GTmetrix's section.
2 - Largest Contentful Paint: This point is equivalent to GTmetrix's Fully Loaded Time and Pingdom's Load Time. It's how long it takes for the site to load all of its components. If the value is lower than 2.5 seconds it's a great result, between 2.5 and 4 seconds it's an ok one, and above 4 seconds means that some component of the site is slowing it down.
3 - Opportunities: Recommended optimizations to the site's content and configuration. Like with Pingdom's ones, most of these optimizations would have to be reviewed with a web developer since they usually require changes to the site's configuration and in some cases code.
4 - Diagnostics: Provides a detailed report of how the site is loaded. It's similar to GTmetrix's Waterfall tab but it presents the information already interpreted and in a concise way, so with it, you can have a precise idea of exactly what can be slowing down your website.
5 - Passed Audits: Here the different checks that passed PageSpeed's test are detailed, this list is minimized by default so it has to be expanded by clicking on the ∨ icon next to it.
The most important result here is Initial server response, this is PageSpeed's TTFB test and if it's fast enough it will say "Initial server response time was short" and show the result value next to it.


Powered by WHMCompleteSolution